Seattle Real Estate “Heat Index” Map Tracks Lukewarm Summer Temps
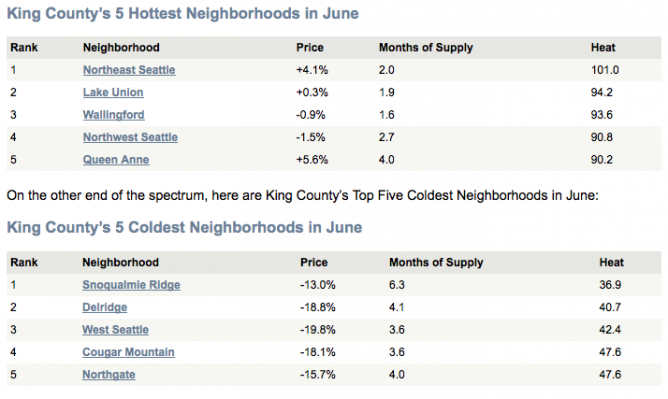
Redfin has created a quick way to see where the hot real estate markets are, rather than poring over spreadsheets. If you are a true real estate wonk, you probably still want to check out their June data, since the map (below) differs in some respects from the detail you get from the numbers: As Redfin’s Tim Ellis explains, “The map breaks it down by zip code (and uses SFH or Condo or Townhome, whichever had the most sales in that zip code), but the table shows neighborhood breakdowns (and uses only SFH).”
Redfin, like many Seattleites, considers 75 degrees perfectly comfy, so that’s the baseline, and reflects “6.0 months of supply and +5 % price change year-over-year.” Seattle has some hot spots, but in general this is the summer of real estate inventory discontent. As you can see from the graphic, there’s just not a lot available.

Refin's Hot and Not Neighborhoods
From Redfin’s blog: “New listings are slow to hit the market, and buyers are getting frustrated with the inventory,” said Redfin Redmond/Bothell Agent Kurt Pepin. “Buyers are anxious to buy, but are also being very smart about their purchases. The pure emotional buy is gone, while crunching every number possible has become the new norm.”
Case-Schiller May home prices for Seattle were down seven percent year-over-year. Voters at the Seattle Bubble (Ellis’s other project) overwhelmingly say that foreclosures haven’t peaked, and the news backs them up. Nationally, RealtyTrac reported one million homes were foreclosed on in 2010, and expects this year to be worse, even with an additional one million foreclosures punted to 2012 as mortgage servicers attempt to foreclose with legal paperwork.

 Daily Email Digest of The SunBreak