This factoid jumped out at me from the Seattle Department of Transportation’s 2010 Traffic Report. Guess what the weather was like when 71 percent of all car-bicycle collisions took place? Clear or partly cloudy. Fourteen percent of collisions occurred when it was overcast. Only twelve percent when it was rainy.
You just assume that the weather is bad, it’s slippery, there’ll be more accidents. But no. In Seattle, looking at the absolute numbers, high season for bicycle-related accidents for the past five years are the months May through September, with April and October as the shoulders. That makes sense in one way because there are simply more cyclists out and about when the weather is nice.

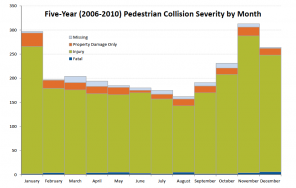
But consider the statistics for pedestrians, who are also, you assume, out and about when the weather is nice. Seattle is flush with tourists not looking where they are going each summer. Yet the pedestrian high (-chance-of-being-hit) season is the months November through January. Again, common sense, except you might apply the same common sense to bicyclists (weather’s bad, it’s dark, can’t be seen) and be wrong.
Nor does clothing visibility seem, in this batch of statistics, to offer much of an advantage. Of the collisions where the bicyclist’s clothing was noted, 35 were wearing light or reflective clothing compared to 42 wearing dark clothing, and 122 who were wearing “mixed” light and dark clothing. The lesson seems to be to go bright or go ninja, but don’t hedge your bets.
Most dangerous day of the week? Wednesday. Least dangerous? Sunday (I would guess simply because of lower traffic volumes). Most dangerous hours of the day? 8 to 9 a.m., and 3 to 7 p.m. The leading age group for accidents is 25-34.
The leading reason a driver hit a bicyclist (142 times) was given as failure to grant the right of way. But before cyclists get their chamois-padded bike briefs in a twist, consider this: in 66 collisions, the bicyclist failed to grant the right of way to a pedestrian. The collision was most likely to happen at an intersection (60 percent), and another surprise, more likely to happen when bicyclists were riding with traffic (32 percent) than entering or crossing traffic (18 percent).
That said, SDOT’s data can be surprisingly incomplete. In the last instance, 45 percent of the time, no one knew or wrote down what the cyclist was doing–a startling omission given that these are car vs. bike collisions. The age of the bicylist was undetermined 21 percent of the time. 45 percent of the time the “facility type” (e.g., roadway, bike route) was missing.
I would also take issue with SDOT’s assertion that “the citywide count showed a decline in bicycling” of 15 percent. A one-day count is really only useful for establishing the presence of something. Whatever else is true, citywide, some 3,961 people biked around Seattle on a particular day in 2010. But you can’t be sure, by comparison solely to previous one-day counts, whether you’re really seeing an increase or decrease. That’s true as well of the 20 percent “uptick” in bike commuters to downtown, of 3,251. Maybe it is an increase. But really, it’s more important to know that 3,251 people biked to downtown. So when people tell you how impossible it is to commute to downtown on a bike, you have 3,251 comebacks.