For context, Washinton state’s C average for infrastructure, awarded by the American Society of Civil Engineers, looks good against the U.S. average of a D+. The categories graded nationally include: aviation, bridges, dam, drinking water, energy, hazardous waste, inland waterways, levees, ports, public parks and recreation, rail, roads, schools, solid waste, transit, and wastewater. Almost everything to do with water gets a D or worse. Schools, hazardous waste, and aviation all get a D.
The ASCE estimates it would take an investment of $3.6 trillion by 2020 to get that national grade up to a C. But let’s be clear: as ASCE attorney for legislative affairs Larry Costich said on a conference call this morning, “A C is mediocre,” and that in terms of weighting, “public safety is our highest goal.” A team of 15 authors (plus peer reviewers) tackled the nine graded sections for Washington — we covered the report card when it first came out:
Here in Washington State, we are first in renewable energy, out of all the states. But we are faced with the unpleasant and yet unsurprising news that, with 83,505 public road miles, 67 percent of those roads are in poor or mediocre condition. Almost five percent of our bridges are rated structurally deficient (see “Seattle’s Worst Bridges“), with more than 20 percent “functionally obsolete.”
Laura Ruppert, the report card committee co-chair, explained that Washington’s highest grade, a B, was awarded to its dams. The state’s dam safety program boasts just “8.5 full-time employees” (No, we’re not sure how you achieve that feat, either), who each oversee some 121 dams. Though the state spends about $1.3 million annually on regulating the dams, the engineers note that many of the dams themselves are privately owned and maintained.
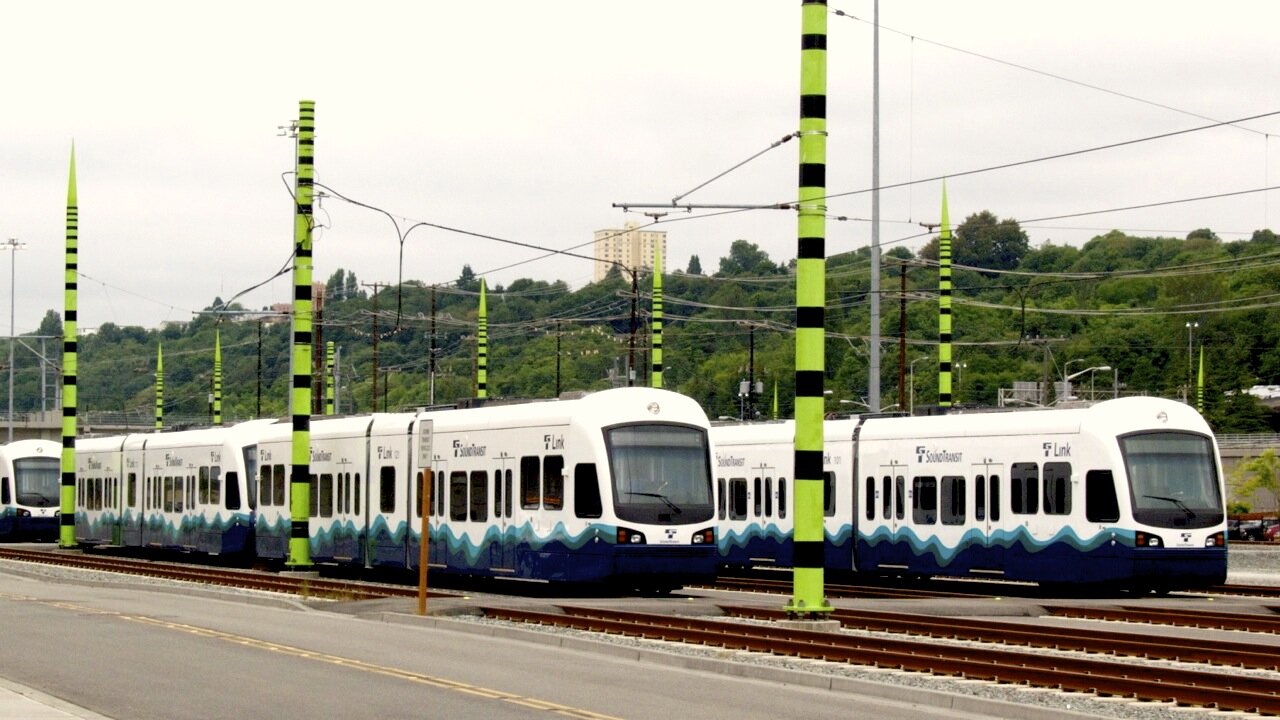
Washington’s D+ subjects were roads and transit, even though, as the ASCE’s Shane Binder was quick to clarify, the state has very good track record in terms of safety — especially through its sustained reduction of highway fatalities — and a very good track record for accountability on its projects. Transit ridership, too, is far above the national average. But the state directly runs and funds perhaps 15 percent of its road system: the rest devolves to county or municipal control, and state funding for those roads downstream has been dwindling. Ruppert compared running maintenance deficits to letting a roof leak: “The more we kick the can down the road, the more expensive it becomes.”
“We need to identify a stable long-term funding source for roads and transit,” says Binder, pointing out that despite a substantial investment in transit infrastructure over the past decade, paradoxically, funding for transit service has decreased substantially. (King County Metro is hoping to cadge permission for new funding from the state in the special session ongoing.) That’s troubling given the Seattle-area correlation of transit usage with economic growth.
Asked if a proposed transportation package of $8.4 billion — funded by a gas tax, with just $911 million devoted to maintenance and operations — was at all a step in the right direction, Costich seemed to shrug. “Maintenance is a critical component,” he repeated, but acknowledged that the region is also growing. He’d prefer that gas taxes be indexed to inflation, at least, but even so, he asked, is it a sustainable source of revenue? Given that a reliance on gas taxes has led to that D+ grade for roads, one might conclude that no, it is not.
Other factoids of note from the report card:
- Washington has 49 hazardous waste sites on the National Priorities List.
- Washington has approximately 713 miles of levees.
- Washington has reported an unmet need of $218.3 million for its parks system.
- It is estimated that Washington schools have $6.3 billion in infrastructure funding needs.
