Tag Archives: redfin

In Seattle Real Estate, a Big Spring Bounce for a Happy Few

Seattle Bubble, not easily impressed, is impressed: “the spring bounce in 2012 has shot the median list price per square foot to its highest point since November 2010.” Sale price, at about $175 per square foot, is lagging list price, which is north of $195 per square foot, but catching up as sellers latch on to their leverage: very low inventory. King County has the fewest single-family homes on the spring market in over a decade.

(Graphic: Redfin)

It’s a little counterintuitive, but this pricing situation is strengthening buyer confidence that the value of their purchase won’t continue to fall. Real estate mavens Redfin just completed a Q2 survey of home buyers, and the Seattle respondents were almost unanimous in reporting that they were most surprised by the tight inventory (much of which is in terrible condition, they say), and the speed of sales of good homes. Sales volume in Seattle was up 22 percent in May, year-over-year.

It’s worth noting that sales of bank-owned homes dropped to less than 14 percent of the sales total in May (again, King County single-family). A search on foreclosures listed in the Seattle area through Redfin yields just 233 listings (from a total of 2,179). Underwater home owners aside, there appears to be no hidden-inventory tsunami threatening. It’s a big change.

So who’s buying? 83 percent of the 222 Redfin respondents in Seattle reported being between 25 and 44 years old. Just over half were shopping for a home in the $250,000-to-$500,000 range. 63 percent were currently renting, and 82 percent thought it was a good time to buy (only one-third were worried about prices falling). 16 percent had already made an offer and lost out to a higher bidder.

“Conventional sellers haven’t stepped in to replace the liquidity that once came from banks dumping lots of foreclosures,” writes Redfin’s Glenn Kelman in a blog post. “In our own business, we are seeing website traffic slowing due to lack of inventory even as activity levels remain high among the customers we have.”
Redfin: “It’s All About the Inventory”

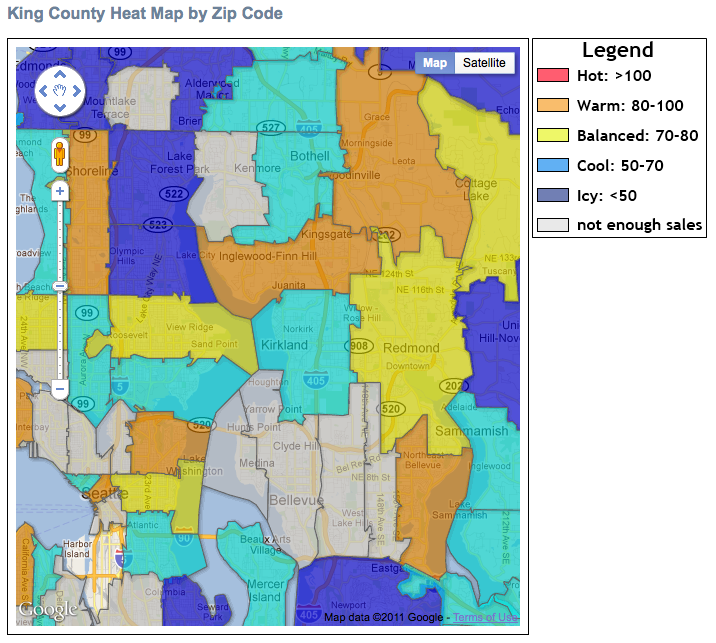
Redfin's Seattle heat map for July 2011

Redfin’s August round-up of real estate news, trends, and financing desiderata is out, and it’s a good news-bad news assessment. “Prices are stable again, rising in most markets since April,” writes Glenn Kelman, but he cautions that limited inventory is behind the stabilization, and that winter’s typically slower (than summer) sales volume lies ahead.

If you are a shadow-inventory catastrophist, you may be cheered to hear that Kelman thinks the problem may not be as first thought. Or you may calculate that any iceberg above a certain size is enough to sink a large ocean liner.

Redfin’s Seattle-area heat map for July shows a few bastions of hot property (prices up, multiple offers): Magnolia, Ballard, Queen Anne, and North Seattle. They’re enough to keep Seattle at 12th on the national heat index (but at a tepid 56.6 “degrees,” behind Portland at 59). Home values were down most in Lake Union, Rainier Valley, Lake City, Delridge, and Snoqualmie Ridge.

Seattle Bubble calls it a “flat, boring summer” and notes that King County’s median home price of $350,000 has rewound to roughly 2005. “[E]ven during the worst year of the dot-com recession in 2002 we had 25% more sales in August than we did this year,” offers Tim Ellis, for contrast, in his follow-up post on NWMLS stats.

To give you an idea of what foreclosures are still doing to home values, here’s $104,000 1-bedroom “Fannie Mae, HomePath-owned Condo” near 23rd Avenue and East Cherry. Someone on Capitol Hill really wants out of their condo: This studio’s price was dropped $20,000 to $119,000, and it sits at 17th Avenue and John Street, a hop, skip, and jump from Trader Joe’s and Madison Market. Plus, a classic claw-foot bathtub.

Seattle Real Estate “Heat Index” Map Tracks Lukewarm Summer Temps

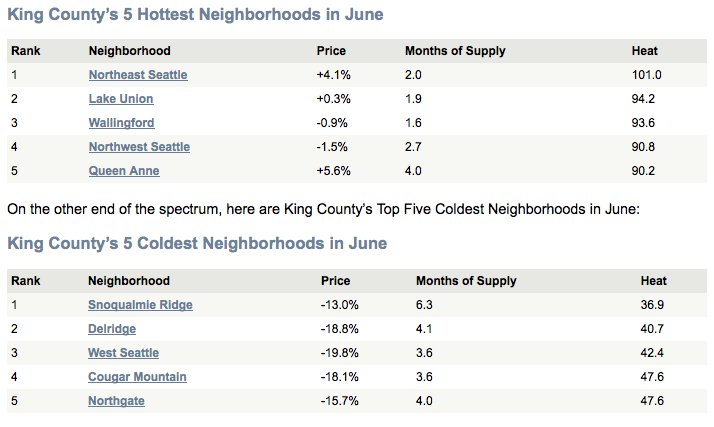
Redfin has created a quick way to see where the hot real estate markets are, rather than poring over spreadsheets. If you are a true real estate wonk, you probably still want to check out their June data, since the map (below) differs in some respects from the detail you get from the numbers: As Redfin’s Tim Ellis explains, “The map breaks it down by zip code (and uses SFH or Condo or Townhome, whichever had the most sales in that zip code), but the table shows neighborhood breakdowns (and uses only SFH).”

Redfin, like many Seattleites, considers 75 degrees perfectly comfy, so that’s the baseline, and reflects “6.0 months of supply and +5 % price change year-over-year.” Seattle has some hot spots, but in general this is the summer of real estate inventory discontent. As you can see from the graphic, there’s just not a lot available.

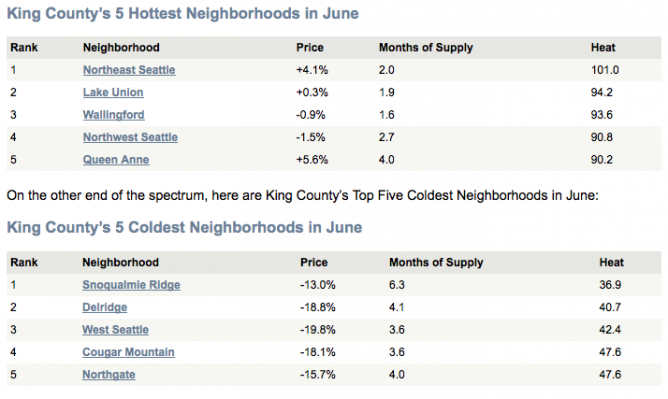
Refin's Hot and Not Neighborhoods

From Redfin’s blog: “New listings are slow to hit the market, and buyers are getting frustrated with the inventory,” said Redfin Redmond/Bothell Agent Kurt Pepin. “Buyers are anxious to buy, but are also being very smart about their purchases. The pure emotional buy is gone, while crunching every number possible has become the new norm.”

Case-Schiller May home prices for Seattle were down seven percent year-over-year. Voters at the Seattle Bubble (Ellis’s other project) overwhelmingly say that foreclosures haven’t peaked, and the news backs them up.  Nationally, RealtyTrac reported one million homes were foreclosed on in 2010, and expects this year to be worse, even with an additional one million foreclosures punted to 2012 as mortgage servicers attempt to foreclose with legal paperwork.

Heat Map Color Legend