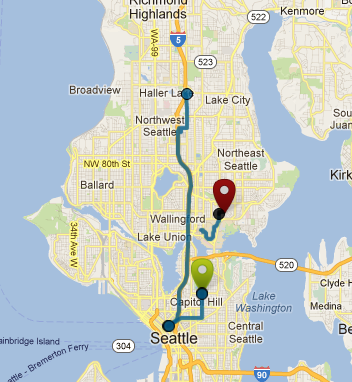
This is not how we would get to the U Village Apple Store. (Image: WhichBus)
Last August, the new WhichBus online app reached private beta; this week, they’re open to the public at WhichBus.org, helping you plan your next trip on King County transit.
What distinguishes them from OneBusAway and its real-time when’s-the-next-bus info, is their trip-planning assistance. WhichBus is also built on real-time bus movement, but the interface is based on getting you from Point A to Point B.
It’s beautifully simple (and award-winning). You can write in your locations of choice (or tell it to determine your location for you), and the search function has gotten much, much better at using place names like “Space Needle” instead of requiring specific addresses.
Seattle’s internecine transit system, with its dearth of system and route maps and schedules, makes this kind of service a necessity. But I can’t advise use of WhichBus for newbies yet. For one thing, there’s no app version available — they’re waiting for Apple approval.
For another, you just can’t trust it: To the right, you see it delivering what looks like an impossibly circuitous (if not downright impossible) route from Capitol Hill to the University Village Apple Store. I’ve tested a few routes on it, and it seems overly inclined to direct you to downtown to pick up a transfer to a bus actually heading in the direction you want. Downtown plus a transfer makes almost any trip in Seattle take an hour.
If you’re starting from Seattle Center and trying to get to Capitol Hill, WhichBus quite rightly suggests the #8. But if you’re starting from Capitol Hill, it suggests you take the #10 or #12 downtown, then catch a bus to the Center, which — as slow as the #8 bus is — is usually a longer route. Presumably, all this requires is some algorithmic tweaking, but unless you know Seattle’s bus system well enough to know you’re being had, I’d wait a bit on this.
Each year, a few King County Metro bus routes battle it out for the distinction of being named the “most dangerous” in the system. One year it’ll be the 7, the next the 358. But you have to be careful: the Seattlepi.com was counting operator assaults when it crowned the 7, the Weekly was counting “security incident reports” when it selected 358.
To be fair to the chronically thrill-a-minute leaders here, the 7 and 358, absolute counts of SIRs aren’t apples to apples. Some bus routes run peak times only, some peak and off-peak, and some late night, as well as running at different frequencies throughout the day. Simply put, some bus routes offer longer bus service, more often, than others. If you run past 2 a.m., you’re going to get more people sleeping on the bus, which can bring about a security report (see below).
The 358 begins its day at 4:28 a.m. and ends at 1:02 a.m. During both peak and off-peak hours, it averages about 50 passengers per platform hour. At night, that falls to 33 rides on average. During peak hours, it runs about every 10 minutes, up and down Aurora. The 7, the Rainier Beach bus, begins at 4:19 a.m. on a curtailed route. Its last stop of the day is at 3:55 a.m., less than half an hour before it starts up again.
There’s no denying, though, that whatever inspires SIRs to be filled out, the 358 and 7 routes have got what it takes. The 358 racked up 334 reports in 2011, the 7, 245 of them. The third highest was the 671 with “just” 145. In contrast, 61 very boring Metro routes managed to get written up just once all year, with about 140 of the 220-some total routes sticking in the single digits.
In trying to establish a base rate of nuisance behavior, I checked on two routes I ride frequently at all times of the day and night without shivering with foreboding. The 43, which shuttles between the U-District and downtown acquired 57 reports, while the 10, which runs between Capitol Hill and downtown had 41. If somewhere above 60 SIRs edges into “sketchy” territory–keeping in mind the handicap needed for all-hours buses–sixteen Metro routes will make you wish you had your headphones and dark glasses with you.
There are plenty of 358 horror stories (it has its own Twitter hashtag), and the 7 has been infamously described as “colorful,” but let’s also take a look at what can generate a security incident report. According to spokesperson Linda Thielke, the incidents can range from an assault to asking a “sleeper” to get off the bus. Here’s the list:
Physical assault on operators or passengers
Operator witnesses an assault off the coach
Harassment & threats of harm
Intentional damage or vandalism to Metro property
Theft of personal or passenger property
Chronic fare evasion
When police enforce the Code of Conduct (this is a very broad category & includes people who sleep on the seats and won’t wake up)
When someone is asked to leave the coach (also covers “sleepers”)
When requested by a supervisor, coordinator or base chief
If it’s not that often your personal safety is at risk on a bus, it’s certainly memorable when it is, not least when the safety of everyone is threatened by an attack on the driver. In 2010, operators reported being assaulted 85 times. There are more than 2,800 operators, so assuming no repeat beatings, that’s three percent of them in harm’s way; Metro doesn’t break out on its Safety & Security page whether any have been assaulted twice in the same year.
It’s notable that May is, regularly, open season on bus operators–for the past three years, there’s been a late-spring spike in incidents. And in 2010, Metro reported 2,659 arrests and infractions across the system, or some 220 per month, which would work out to about one arrest or infraction (on average) per month per route, if you cared to figure it that way.
But let’s take a step back and widen our perspective. How about accidents? In 2011, Metro averaged about 32 accidents per million miles traveled, with slightly more than 30 percent of those being preventable. Do you know what the comparable car statistics are? I can’t find them, and I suspect that’s because they are far too numerous. When you look up traffic safety statistics, they’re strictly about fatalities.
The fact is, you’re more likely to die–not be scared, or be hassled–while driving a car, reminds the National Safety Council: “In 2008, the passenger death rate in automobiles was 0.55 per 100 million passenger-miles. The rates for buses, trains and airlines were 0.08, 0.13, and 0.00 respectively.” It’s strange, but when people give their reasons for not riding the bus, they usually mention issues of convenience, and if pressed will bring up safety concerns. But the converse is not true–you almost never hear bus riders pointing out that they prefer their significantly better odds of not dying in a traffic accident.