Belltown boulevardier Ronald Holden tips us that armed, private security guards will be patrolling First Avenue in Seattle, the three blocks from Battery to Lenora, after a recent fatal stabbing. “Seattle’s 25th homicide victim this year is identified,” reported the Seattle Times, noting that the victim, 21-year-old Faustino Cervantes was stabbed in the stomach after getting into a dispute with four men outside Tia Lou‘s.
Ironically, the up-to-6-man security detail is courtesy of the unsettled owners of Sarajevo Lounge, where you can get such Bosnian favorites as cevapi and roasted lamb. Except for that fatal stabbing, and the fact you need to be more specific than “Belltown” and “shooting” when searching for the latest area incident, an observer might think that Sarajevo Lounge’s Dino Stalina and Denis Kurdija have hit upon a way to publicize their security company Central Protection.
But the two told KCPQ News that it’s their restaurant business that they’re worried about. Belltown’s sporadic violence and open-air drug deals are keeping customers away. Belltown businesses have long cried out for police foot patrols–earlier this year, after 22 homicides, the city established a few “hot spot” beats for foot patrol officers. But those are constrained by the need to fit into existing SPD budgets.
Stalina and Kurdija hope that the sight of uniformed men with guns will be enough to make hoodlums think twice; Seattle police spokesman Sean Whitcomb told KCPQ that the security guards would be “working with” the police department, acting as “eyes and ears.” Stalina and Kurdija have plans to create a “black list,” shared among Belltown nightspots, to keep troublemakers out, and imagine that, with collective financial support, security details could be on call to walk people to their cars.
Still, their guards will be armed, and given Belltown’s history, it’s likely that one night they’ll confront someone who’s also carrying a gun. In a corollary to Russian playwright Chekhov’s dictum, any gun you see in the first act can be expected to go off by the third.
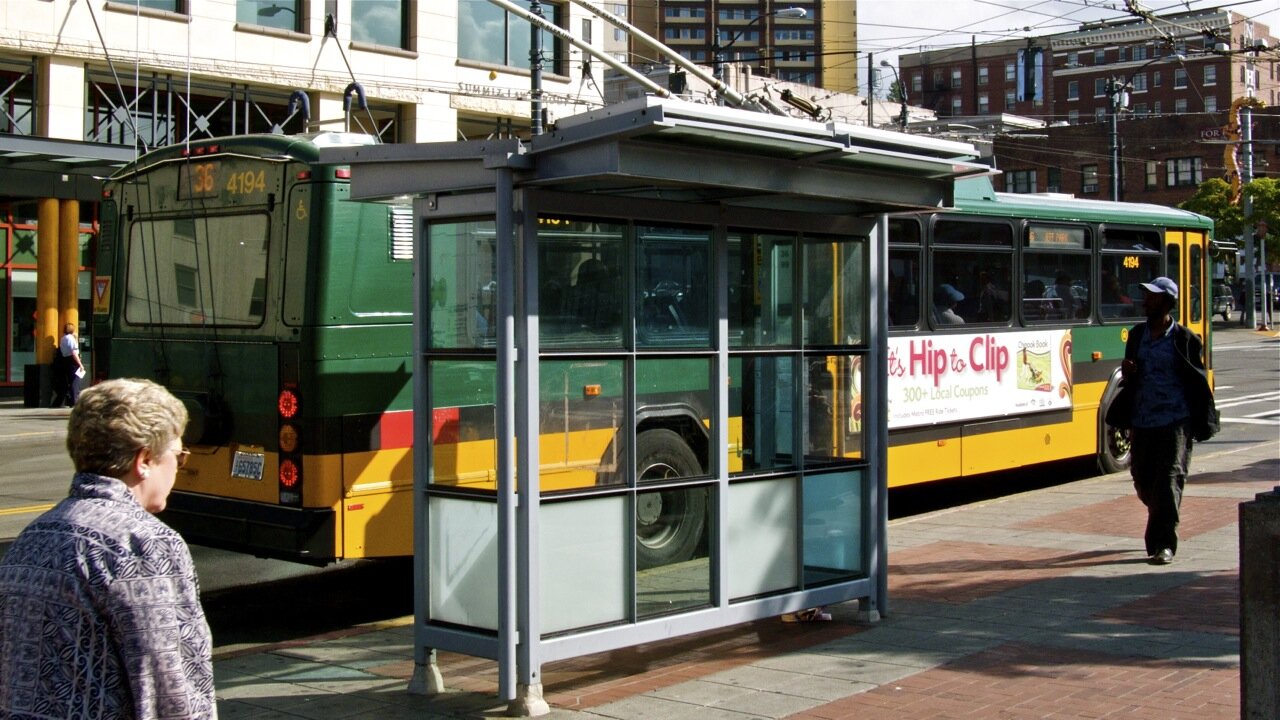
Each year, a few King County Metro bus routes battle it out for the distinction of being named the “most dangerous” in the system. One year it’ll be the 7, the next the 358. But you have to be careful: the Seattlepi.com was counting operator assaults when it crowned the 7, the Weekly was counting “security incident reports” when it selected 358.
To be fair to the chronically thrill-a-minute leaders here, the 7 and 358, absolute counts of SIRs aren’t apples to apples. Some bus routes run peak times only, some peak and off-peak, and some late night, as well as running at different frequencies throughout the day. Simply put, some bus routes offer longer bus service, more often, than others. If you run past 2 a.m., you’re going to get more people sleeping on the bus, which can bring about a security report (see below).
The 358 begins its day at 4:28 a.m. and ends at 1:02 a.m. During both peak and off-peak hours, it averages about 50 passengers per platform hour. At night, that falls to 33 rides on average. During peak hours, it runs about every 10 minutes, up and down Aurora. The 7, the Rainier Beach bus, begins at 4:19 a.m. on a curtailed route. Its last stop of the day is at 3:55 a.m., less than half an hour before it starts up again.
There’s no denying, though, that whatever inspires SIRs to be filled out, the 358 and 7 routes have got what it takes. The 358 racked up 334 reports in 2011, the 7, 245 of them. The third highest was the 671 with “just” 145. In contrast, 61 very boring Metro routes managed to get written up just once all year, with about 140 of the 220-some total routes sticking in the single digits.
In trying to establish a base rate of nuisance behavior, I checked on two routes I ride frequently at all times of the day and night without shivering with foreboding. The 43, which shuttles between the U-District and downtown acquired 57 reports, while the 10, which runs between Capitol Hill and downtown had 41. If somewhere above 60 SIRs edges into “sketchy” territory–keeping in mind the handicap needed for all-hours buses–sixteen Metro routes will make you wish you had your headphones and dark glasses with you.
There are plenty of 358 horror stories (it has its own Twitter hashtag), and the 7 has been infamously described as “colorful,” but let’s also take a look at what can generate a security incident report. According to spokesperson Linda Thielke, the incidents can range from an assault to asking a “sleeper” to get off the bus. Here’s the list:
Physical assault on operators or passengers
Operator witnesses an assault off the coach
Harassment & threats of harm
Intentional damage or vandalism to Metro property
Theft of personal or passenger property
Chronic fare evasion
When police enforce the Code of Conduct (this is a very broad category & includes people who sleep on the seats and won’t wake up)
When someone is asked to leave the coach (also covers “sleepers”)
When requested by a supervisor, coordinator or base chief
If it’s not that often your personal safety is at risk on a bus, it’s certainly memorable when it is, not least when the safety of everyone is threatened by an attack on the driver. In 2010, operators reported being assaulted 85 times. There are more than 2,800 operators, so assuming no repeat beatings, that’s three percent of them in harm’s way; Metro doesn’t break out on its Safety & Security page whether any have been assaulted twice in the same year.
It’s notable that May is, regularly, open season on bus operators–for the past three years, there’s been a late-spring spike in incidents. And in 2010, Metro reported 2,659 arrests and infractions across the system, or some 220 per month, which would work out to about one arrest or infraction (on average) per month per route, if you cared to figure it that way.
But let’s take a step back and widen our perspective. How about accidents? In 2011, Metro averaged about 32 accidents per million miles traveled, with slightly more than 30 percent of those being preventable. Do you know what the comparable car statistics are? I can’t find them, and I suspect that’s because they are far too numerous. When you look up traffic safety statistics, they’re strictly about fatalities.
The fact is, you’re more likely to die–not be scared, or be hassled–while driving a car, reminds the National Safety Council: “In 2008, the passenger death rate in automobiles was 0.55 per 100 million passenger-miles. The rates for buses, trains and airlines were 0.08, 0.13, and 0.00 respectively.” It’s strange, but when people give their reasons for not riding the bus, they usually mention issues of convenience, and if pressed will bring up safety concerns. But the converse is not true–you almost never hear bus riders pointing out that they prefer their significantly better odds of not dying in a traffic accident.