Mid-May, I was tipped off to the existence of Busdrone for the desktop, a Google map overlaid with King County Metro‘s (and some Sound Transit, when run by Metro) real-time feeds, along with the SLU streetcar and Washington State Ferries.
Busdrone is the handiwork of Andrew Filer, drawing on a number of existing data sources. More recently, as part of the National Day of Civic Hacking, while Filer made more improvements to the desktop version, Eric Butler ported Busdrone to Android. (Android is here; no iOS yet — it’s making its way through Apple’s approval process, says Filer.)
“This comes very close,” I wrote earlier, “to being that all-in-one transit view contains almost all you need to know in one glance: where the bus is, where it’s going, and what other buses are in the vicinity.” But Busdrone’s creators — despite the name — are dreaming bigger than buses. They’d like to get all your transportation options in there, light rail and private transit, too: car2go, Zipcar, Uber, Lyft, Sidecar. That’s great because it’s what the car-less do currently, using a number of apps to cycle through their options depending on criteria like speed or cost.
And why not, Filer and Butler ask, include “location-based realtime data about the city such as 911 Fire responses and traffic collisions“? It always makes sense not to catch the bus that’s going to run straight into gridlock, but when you’re paying by the minute (as with car2go), seeing real-time information about possible slow-downs will feel a bit like a superpower.
To get the best sense of what an incredibly useful tool Busdrone is, all you have to do is just watch it go. It’s amazing how much information is conveyed visually, right there in a single zoom-in or zoom-out view. You don’t really need to know the exact minute that bus, ferry, or streetcar is supposed to show up if you’re tracking it down the street to begin with. (Though the location of stops would be helpful.)
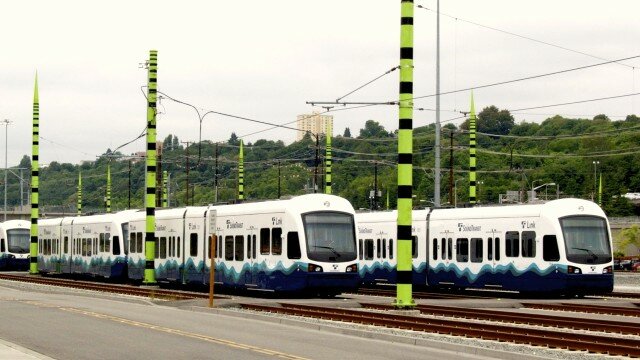
Back in November 2010, this video posted to YouTube of walking from SeaTac baggage claim to the light rail station. It’s since had more than 8,000 views (with no thumbs down — some kind of YouTube record). Sound Transit’s Central Link light rail, running almost 16 miles between downtown Seattle and SeaTac airport, is the cheapest and easiest way to make the trip. The full distance from SeaTac to Westlake Station takes just under 40 minutes, and costs $2.75.
(Map: Port of Seattle)
Depending on time of day, the trains run every seven-and-a-half to 20 minutes. Monday through Saturday, the last train leaves SeaTac at 12:10 a.m. (first train, 5:04 a.m.). On Sundays [because Seattle is not a real city — ed.] the last train leaves at 11:05 p.m. (first train, 6:19 a.m.). Is it that smart to spend $2.57 billion on a transit service and not run it all hours?
One thing the video skips — it does point out the one-time ticket machines — is the placement of the yellow card readers for ORCA card holders. They’re not on the platform where you board the train, they’re down by the ticket machines and easy to walk right past without noticing.
But first you’ve got to find out where the train is.
Signs pointing you to the light rail station, which is connected via a covered walkway about 1,000 feet long, are too few, small, and infrequent once you exit the terminal itself. Like almost all airports, travelers are faced with a thicket of signs for every conceivable thing, so it’s difficult to call out one destination or mode. But certainly the Port of Seattle could do more to orient travelers at that crucial moment they exit the doors of the terminal and begin turning in circles.
1,000 feet is a significant investment for a footsore passenger (note that if you are at the farthest baggage claim the full trek is almost a half-mile). Plus, there are enough bends in the passageway to keep you wondering what’s at the end of it, so you’d really want to see something continuous that confirms you’ve taken the right path, like perhaps a stenciled light rail train running down the floor in front of you. We won’t even suggest the prospect of a smart sign indicating when the next train leaves, stationed at the beginning of the walkway.
Sound Transit’s light rail home page offers travelers no walking map , nor even a link to the Port of Seattle’s map. Puget Sound transit agencies often seem to engage in a sort of counterintelligence when it comes to things like this.
[UPDATE: ST’s Bruce Gray points out the Sound Transit home page does have an airport-light rail map, which makes the absence of a link from the light rail home page particularly strange — if you search Google for “seatac light rail” after all, that is where you end up, not Sound Transit’s home page. To get to the map from there, you need to click on a “Rider’s Guide” that covers all of Sound Transit, read through 10 options, and then choose Popular Destinations, then choose SeaTac Airport.]
What’s interesting about the video above, as traffic for it continues to grow, is that seems terribly easy for Sound Transit and the Port of Seattle to have produced their own version, and yet they have not.
Since its inception, Seattle transit app OneBusAway has been the kind of service you’d have to pry off someone’s home screen. Given King County Metro’s chronic funding shortfalls that keep route schedules from being updated (or even available) at all stops, and the system’s tendency to bog down in rush-hour traffic congestion, OneBusAway’s real-time bus tracking is an essential part of a commuter’s toolkit.
New transit-site-on-the-block WhichBus, which emerged from beta at the beginning of 2013, promises to be “simple” and beautiful” but it doesn’t yet have the years of user-testing that’s now built into OneBusAway. So Metro riders greet any news about their favorite app’s future with distinct wariness. But news, nonetheless, is what University of Washington professor Alan Borning has, as a shared-funding contract ends:
The contract is expiring in mid-May, and sometime around then Sound Transit will be taking over running it. (Sound Transit already has an experimental version of OneBusAway running in parallel with the production system.)
Borning explains that as a year-and-a-half of King County Metro, Sound Transit, and Pierce Transit support for the app (which remains free for download) ends, Sound Transit is officially taking over running the Seattle-based instance, while the UW group continues research and development on how apps such as OneBusAway can provide:
…better and additional types of transit information (such as alerts, real-time replanning, vehicle capacity information, and others), integrating incentives for transit use with OneBusAway, crowd sourcing the detection and resolution of data problems with real-time transit data, and providing tools that seek to benefit all riders, including blind and low-vision, mobility impaired, and others.
Screenshot of WhichBus results
By mid-2011, when Brian Ferris, one of OneBusAway’s creators, was leaving for grüner Google pastures, 50,000 people were using OneBusAway each week. Two years later, that number has more than doubled, to more than 100,000 people. That kind of usage has hardened the app in ways that the WhichBus team can’t match, as of yet. During their beta, they relied upon a pool of 1,200 people who were willing to put up with odd results.
The idea behind WhichBus — which you can see on the minimalist home screen — is that transit is about getting from A to B, not memorizing routes, service intervals, or connections. All the site asks is where you are (type in a location, or let it find you automatically) and where you want to go. You can be precise (street address) or not (“Green Lake”), and it churns out route options for you, with real-time info baked in.
Simplicity has its drawbacks, in a city like Seattle, which maintains an “it’s complicated” relationship with transit. Back in January, I asked WhichBus how to get from Capitol Hill to the University Village Apple Store, which was not just a joke at the expense of hipsters but a difficult problem because the Village is not well-served by transit. Then, WhichBus directed me downtown and out to Northgate. It still does, for a one-hour-and-51-minute trip. Google Maps suggests the three-mile drive should take 10 minutes.
The problem could likely be solved if you could let WhichBus know you were willing to walk up to a mile, but this kind of thing complicates a determinedly simple interface. (In this case, most people could walk the three miles in under an hour, shaving at least an hour off WhichBus’s suggested trip and saving bus fare, to boot.)
University of Washington meteorologist Cliff Mass posed an interesting question to himself on his weather blog recently: “Why all the landslides this winter in western Washington?” Besides the huge slippage on Whidbey Island in late March that made national news, smaller mudslides have played havoc with rail transportation north of Seattle. Writes Mass:
Burlington Northern officials suggest this is one of the worst slide seasons in one hundred years, with a particular focus on their tracks between Edmonds and Everett. Nearly 200 slides have occurred this winter, with 56 of them large enough to reach the tracks.
For context, prior to this rainy season, the worst winter in the last ten years, in terms of mudslide cancellations of Sounder Northline trains, was 2011, with 70. The second worst was 2006, with 40. Sound Transit spokesperson Kimberly Reason said this season the Sounder Northline cancellations are north of 200. (Upping the ante, in early April, a mudslide derailed an Amtrak train.) Over the past four years, that’s more than 340 “missing” trains.
BNSF Railway Spokesperson Gus Melonas has blamed the mudslide epidemic on “extremely rainy conditions” — but, Mass says, not so fast with that “extremely”: “If we go back 6 months, the region around Everett stands out more, reaching 130-150 percent of normal [precipitation]. Yes, a bit wet, but I suspect we could find other periods to equal it.” Yet the number of slides is being called unprecedented.
What stands out is a particularly rainy fall, followed by a not unusual winter. That’s in line with what’s known about landslides, though. Brief torrential rains can saturate upper layers of soil and bring on shallower slides, but to really grease the wheels, it’s sustained heavy rainfall that’s needed, so that the water can find its way to fractures deeper in the ground. That kind of invisible erosion operates over a longer time period, so that a rainy fall correlates with landslides with late winter or early spring.
While Mass notes that winter precipitation in the area is trending downward over the past century, the culprits are more likely to be record daily rainfalls and rainy autumns. NOAA in fact has Seattle’s November rainfall trending upward substantially, for the period 1948 to 2012. For that same period, rainfall exceeded ten inches in 1990 and 1995, 11 in 1998, and 15 inches in 2006.
Other contributing factors, as Mass mentions, are development on the bluffs (impermeable surfaces like roads and roofs concentrate rainwater runoff) and the trains themselves — fully loaded, they transmit vibrations through the ground that show up on seismographs. That last point is of particular concern given the ongoing discussion of adding dozens of coal trains a day (see Sightline’s research on coal train impacts) to freight routes in the Northwest.
The secondary impacts of mudslides on transportation are not always appreciated. The Sounder Northline’s anemic ridership often comes under scrutiny without due credit (or any at all) being given to how often trains are being cancelled. (See the contrast in ridership, north and south, here.) Pundit Dori Monson even tried recently to use Sounder Northline ridership to bash the idea of a city streetcar network, though Seattle proper is generally less troubled by mudslides. In fairness to Monson, he may not understand how numbers work — “The South Lake Union Streetcar, that’s been horrible,” he said, about the successful line that’s been adding service to meet demand.
Though WSDOT is putting a $16.1-million Federal Railroad Administration grant to work, for engineering and mitigation of mudslides, in partnership with BNSF’s efforts, the hard truth may be that landslides have, literally, the high ground in this battle, and will until there’s no high ground left.
It’s a nationwide trend: As jobs return, so do public transit passengers. The American Public Transportation Association says a record 10.5 billion trips in 2012 would have closer to 10.6 except for the impact of Hurricane Sandy on all modes of public transit along the Eastern seaboard. The association attributes the “second highest annual ridership since 1957” to the cost of gas and an improving employment picture. (Thanks to the Slog, who alerted me to the study.)
Currently, the national average for a gallon of gas is $3.69 for regular, $4.01 for premium. (The highest recorded average was summer of 2008: $4.11 for regular.)
In a related Reuters story, APTA spotlights Seattle, “where transit rides rose 11.8 percent over the year as the metropolitan area added more than 30,000 jobs.” From January 2012 to January 2013, the state of Washington added some 65,800 jobs (98 percent of which were in the private sector), with the unemployment rate now holding steady at around 7.5 percent statewide, 6.3 percent in Seattle.
SIDEBAR: In fact, the state can’t quite believe the numbers are as good as the federal Bureau of Labor Statistics says: an increase of 24,100 jobs from December to January that may not be wholly new jobs, but may be due in part to seasonal adjustments and a change in the way the BLS reaches those figures. “Based on historical patterns,” explains chief labor economist Joe Elling, “Washington employment typically falls by 61,300 from December to January.” This year, the BLS estimated a loss of just 37,000, resulting in that “jobs increase” of 24,100. Elling expects these preliminary numbers to be revised to be more in line with an observed 5,000-jobs-per-month trend.
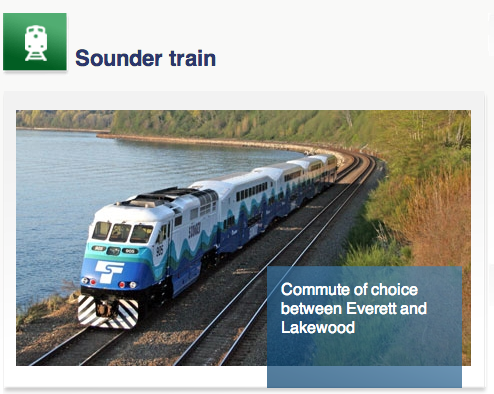
Nonetheless, Seattle is all over the APTA report on top transit ridership in the country during 2012. The Seattle Streetcar‘s ridership jumped five percent (750,294 boardings in 2012), with its First Hill line due to open in spring-summer of 2014 — and that line’s ridership is projected to exceed that of the South Lake Union stretch of rail. (There’s an ongoing fight to bring back the Waterfront Streetcar service, which used to carry several hundred thousand passengers a year as well.) Sounder commuter rail was up eleven percent (more than 2.8 million boardings in 2012), as was Central Link light rail (8.7 million boardings, up almost one million from 2011), reports Sound Transit.
King County Metro’s workhorse bus system carried 4.6 percent more passengers, as well — more than 115 million trips. Some of the boost in ridership can be credited to Viaduct Replacement Project construction and tolling on SR 520, says Metro chief Kevin Desmond, who has to fight for funding to maintain service levels, let alone deal with ridership increases. (Video of Desmond making his case available at Seattle Transit Blog.)
Funding for transit infrastructure is also up: “Last year 49 out of 62 transit-oriented state and local ballot initiatives passed,” said APTA President and CEO Michael Melaniphy, arguing this represented a sea change in public willingness to pay. The rise of transit dovetails with findings in a mid-2012 study, commissioned by the U.S. Conference of Mayors, that tied U.S. metro economies to transportation infrastructure. Have legislators understood this? Seattle Times columnist Jon Talton, whose article surfaced the report for me, wonders.
“If Seattle-Tacoma-Bellevue were a separate country — and many legislators in Olympia apparently believe this to be so — it would have the world’s 53rd largest economy, just behind Israel and ahead of Portugal and Chile,” Talton writes. That $242-billion economy (in 2011) placed Seattle twelfth out of 363 U.S. metros, behind Boston (9th) and San Francisco (8th). It’s in the neighborhood of those of the states of Missouri, Louisiana, or Connecticut. In the decade between 2001 and 2011, it grew an average of 4.4 percent each year.
Taken together with Olympia, the Seattle MSA accounts for more than 70 percent of Washington’s economic product, with about half of the state’s nearly seven million inhabitants. By 2042, the study authors expect the Seattle MSA to grow 40 percent, to nearly five million. By 2020, they anticipate another 285,000 jobs.
Interestingly, since 2000, Seattle’s congestion costs (figured by cost of gas and driver time) have actually fallen: to $942 per year in 2010 versus $1,102 per year a decade earlier. That puts the Seattle MSA in tenth place nationally, behind Boston (9th), Denver (8th), and San Francisco (7th).
Congestion also impacts freight tonnage, where Seattle is twelfth, ahead of Boston this time, but behind Minneapolis. Usually, exports represent between 15 and 16 percent of Seattle’s gross metropolitan product (that ratio changed during the recession, edging into the 20s as exports stayed strong).
“Investment in roads, rails, and other forms of transportation,” claim the authors, “will help relieve the bottlenecks impeding economic expansion,” though they also write that “road capacity has not kept up with passenger growth, and public and alternative transportation usage and development has not been substantial enough to pick up the slack.” They also envisioned the average price for a gallon of gas falling to $3.11 per gallon at the end of 2012 (remember it’s around $3.70 now).
Doesn’t it seem that, in metro areas particularly, public transportation would come first, with roads taking up the slack?
The demand for transit in Seattle seems an indicator that the current ratio of roads to transit is unappealing to metro voters. A $10-billion transportation package unveiled by the state’s House Democrats would spend the vast majority of that $10 billion on new road projects, with $1 billion for maintenance and even less than that for public transportation. It does not help fund the 520 floating bridge replacement, which remains more than a billion dollars short, or the SR 99 tunnel. It doesn’t sound like it has yet sunk in, as STB announces, “Transit Supporters are the Key Swing Vote.”
Sounder North average weekday ridership (Data: Sound Transit)
Sound Transit has a problem that needs solving. As expressed by their Citizens Oversight Panel, it is this: “the tax-payers and transit users of Snohomish County will not be well served if the high-cost Sounder North line continues to run well below capacity while the much lower-cost ST Express bus routes run overloaded with passengers standing in the aisles.”
Far from defending Sounder North, Seattle Transit Blog applauded the panel’s report, calling it “a pretty devastating evaluation of the north line as a regional mobility project.”
The high costs derive from both the establishment of the Sounder North line between Everett and Seattle (Sound Transit paid track-owner BNSF $258 million for permanent rights to use the tracks, and for upgrades necessary for passenger rail, $57 million for stations, and $42 million for trains), and from operating costs.
In the Seattle Times, Mike Lindblom puts a $29-per-passenger dollar amount on the Sounder North service in 2010, excluding capital costs. (The COP report puts operating costs at $32 per passenger in 2011. In comparison ST’s bus service from the north has a $5-per-boarding cost.)
As if to cement its snakebit reputation, the day after the Times story, a Sounder North train then hit a semi truck trapped on the tracks when signal arms came down.
But if most everyone can agree that there’s a problem, the question of what to do about it remains. The panel’s advice to Sound Transit is to find a way to increase average daily ridership to 2,400 within eight years, roughly double the current 1,125 riding weekdays now. That’s fine advice, but one can assume that Sound Transit has been trying that already. As you can see from the graph above, ridership hasn’t budged–at least in an upward direction.
So what, given Sounder South’s popularity, is holding Sounder North back? People can reel off lists of reasons: a limited walkshed (and driveshed, thanks to limited parking spaces at stations); inconvenient, infrequent schedules; a lack of stops (only the Mukileo and Edmonds stations were built, despite initial plans for Richmond Beach and Ballard stations as well); a higher fare; a more complex overall commute; and so on.
But as Lindblom mentions, where there’s a will, there’s a way: On Seahawks Sundays special Sounder North trains carry up to 3,000 passengers. So the potential is there, if people are determined to get to Seattle. Two trains leave at 10:15 a.m. and 10:30 a.m., and return beginning 15 and 35 minutes after the game is over.
What can be changed? Due to subarea equity agreements, the service can’t simply be cut off. It would have to be made up in some way.
Sound Transit wants to add station parking spaces (“in Edmonds 156 stalls are at 97% utilization and in Mukilteo 63 stalls are at 89%,” says the COP report). They can’t add trains (the agreement with BNSF is for four roundtrips per day), and it would be difficult to improve the schedule by and large (BNSF wants “prime time” for its freight trains, including those extra coal trains you’ve been hearing so much about).
ST does hope to tweak the schedules by a few minutes to tie in better with ferry schedules at Mukilteo and Edmonds, but the four Sounder trains will still leave Everett in that general 5:45-to-7:15 a.m. window, and return between 4:05 and 5:35 p.m. (Yes, it does seem unreasonable to have three out of four commuter trains leave before 5 p.m.)
It’s $4.50 to ride the whole way from Everett to Seattle and vice-versa, but ST believes that its ridership isn’t particularly price sensitive, because they are using ORCA cards paid for by their employers. Since they are only getting 11-percent farebox recovery, it isn’t likely they can budge on price.
With Sounder North trains running at 30 percent of capacity, ST also plans to transfer two to four coach cars to a new Sounder South trip late next year.
What is not in Sound Transit’s control, however, is mudslides. The track, and its condition, is in BNSF’s hands, per the lease. It’s difficult to sell daily commuters on the reliability of rail when 70 Sounder North trains were canceled during 2010-11, and 33 in 2011-12. During that especially rainy 2010-11 winter, the 48-hour rule came into effect five times.
(BNSF says the primary concern is safety, to make sure more mud isn’t on the way, but as a Seattle Transit Blog commenter notes, mudslides create freight backups that need extra time to clear without passenger trains in the way. Other commenters ask whether there isn’t demand enough to run a single Sounder line from Everett to south Seattle.)
ST has arranged “bus bridges” so that rail passengers aren’t stranded, but it’s pretty much a given that on some cold, rainy, dark morning or evening, Sounder passengers will find themselves taking the long way to their destination, instead of relaxing in comfort. The buses pressed into service are often over-crowded, forcing passengers to stand the whole way. If this happened 70 times one winter, wouldn’t you consider just taking the bus–or driving–to begin with?
Looking at the top chart, you see that ridership takes a full year to recover ground from the disastrous 2010-11 winter. After seven train trips were canceled in November 2011, daily average ridership fell by 300 in December. I can’t show causation, but nothing like that happened the same period in 2009, which had no train-canceling mudslides. In 2010, ridership fell by 175 daily boardings in December, but then there were eight canceled train trips in December.
I would argue that the most significant factor in maintaining ridership, and building it through good word-of-mouth, is the elimination of canceled trains due to mudslides. When I look at Sound Transit’s ridership history (see Impacts to North Line Ridership), it seems miraculous that there are 1,000 people so dogged they won’t let 30 canceled trains in January 2006 (and 44 in March 2011!) keep them from showing up at the station at 5:45 a.m. on a winter morning. (That last is for effect; obviously not everyone shows up for the 5:45 a.m. train.)
I harp on this because while in retrospect these still seem large numbers, that still doesn’t compare to the sense of uncertainty passengers must endure, day after day, during these peak-mudslide seasons. The good news is that WSDOT applied for and won a $16.1-million Federal Railroad Administration grant for engineering and mitigation of mudslides: “Approximately $6 million for engineering and $10 million for mitigation projects/construction,” says ST’s Kimberly Reason. We’ll have to see if that’s commensurate with the scope of the problem, or if Sound Transit can pressure BNSF into taking more action. This winter, so far, augurs to be what’s known as a “neutral” year, which can be particularly stormy.