Tag Archives: study

Seattle Takes Light Rail Train to Job Growth

(Photo: MvB)
(Photo: MvB)

It’s a nationwide trend: As jobs return, so do public transit passengers. The American Public Transportation Association says a record 10.5 billion trips in 2012 would have closer to 10.6 except for the impact of Hurricane Sandy on all modes of public transit along the Eastern seaboard. The association attributes the “second highest annual ridership since 1957” to the cost of gas and an improving employment picture. (Thanks to the Slog, who alerted me to the study.)

Currently, the national average for a gallon of gas is $3.69 for regular, $4.01 for premium. (The highest recorded average was summer of 2008: $4.11 for regular.)

In a related Reuters story, APTA spotlights Seattle, “where transit rides rose 11.8 percent over the year as the metropolitan area added more than 30,000 jobs.” From January 2012 to January 2013, the state of Washington added some 65,800 jobs (98 percent of which were in the private sector), with the unemployment rate now holding steady at around 7.5 percent statewide, 6.3 percent in Seattle.

SIDEBAR: In fact, the state can’t quite believe the numbers are as good as the federal Bureau of Labor Statistics says: an increase of  24,100 jobs from December to January that may not be wholly new jobs, but may be due in part to seasonal adjustments and a change in the way the BLS reaches those figures. “Based on historical patterns,” explains chief labor economist Joe Elling, “Washington employment typically falls by 61,300 from December to January.” This year, the BLS estimated a loss of just 37,000, resulting in that “jobs increase” of 24,100. Elling expects these preliminary numbers to be revised to be more in line with an observed 5,000-jobs-per-month trend.

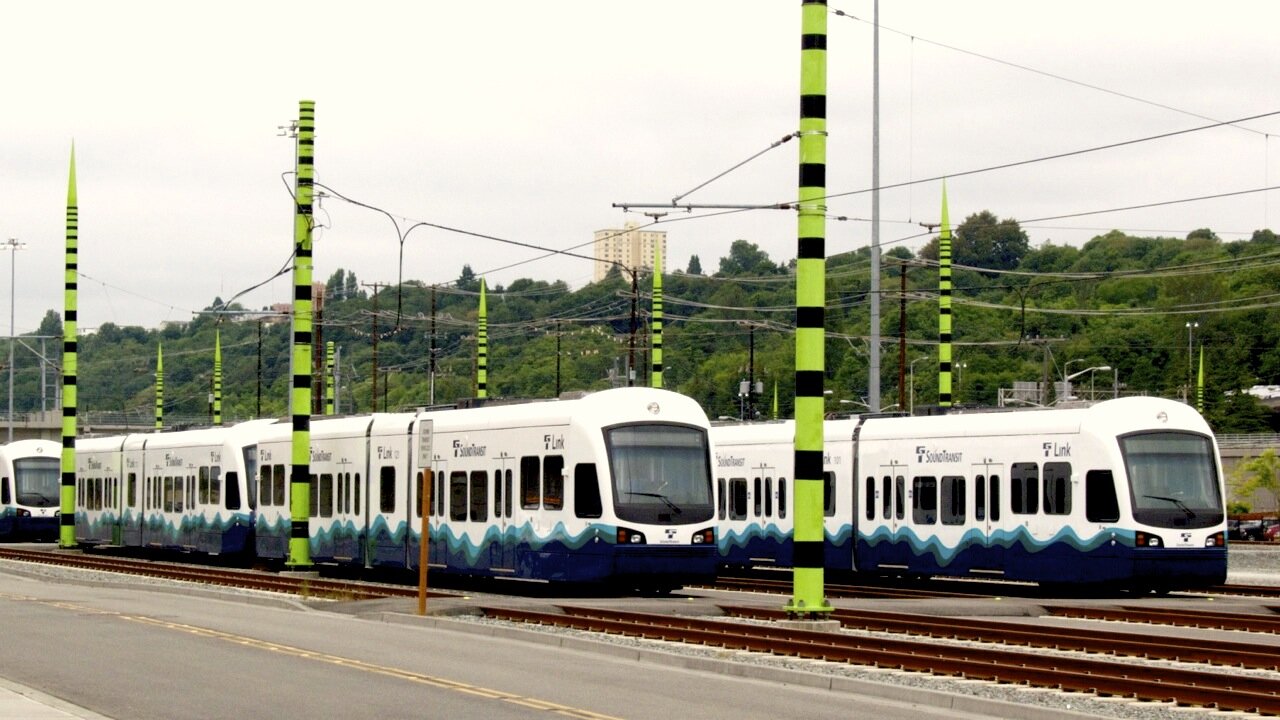
Nonetheless, Seattle is all over the APTA report on top transit ridership in the country during 2012. The Seattle Streetcar‘s ridership jumped five percent (750,294 boardings in 2012), with its First Hill line due to open in spring-summer of 2014 — and that line’s ridership is projected to exceed that of the South Lake Union stretch of rail. (There’s an ongoing fight to bring back the Waterfront Streetcar service, which used to carry several hundred thousand passengers a year as well.) Sounder commuter rail was up eleven percent (more than 2.8 million boardings in 2012), as was Central Link light rail (8.7 million boardings, up almost one million from 2011), reports Sound Transit.

King County Metro’s workhorse bus system carried 4.6 percent more passengers, as well — more than 115 million trips. Some of the boost in ridership can be credited to Viaduct Replacement Project construction and tolling on SR 520, says Metro chief Kevin Desmond, who has to fight for funding to maintain service levels, let alone deal with ridership increases. (Video of Desmond making his case available at Seattle Transit Blog.)

Funding for transit infrastructure is also up: “Last year 49 out of 62 transit-oriented state and local ballot initiatives passed,” said APTA President and CEO Michael Melaniphy, arguing this represented a sea change in public willingness to pay. The rise of transit dovetails with findings in a mid-2012 study, commissioned by the U.S. Conference of Mayors, that tied U.S. metro economies to transportation infrastructure. Have legislators understood this? Seattle Times columnist Jon Talton, whose article surfaced the report for me, wonders.

“If Seattle-Tacoma-Bellevue were a separate country — and many legislators in Olympia apparently believe this to be so — it would have the world’s 53rd largest economy, just behind Israel and ahead of Portugal and Chile,” Talton writes. That $242-billion economy (in 2011) placed Seattle twelfth out of 363 U.S. metros, behind Boston (9th) and San Francisco (8th). It’s in the neighborhood of those of the states of Missouri, Louisiana, or Connecticut. In the decade between 2001 and 2011, it grew an average of 4.4 percent each year.

Taken together with Olympia, the Seattle MSA accounts for more than 70 percent of Washington’s economic product, with about half of the state’s nearly seven million inhabitants. By 2042, the study authors expect the Seattle MSA to grow 40 percent, to nearly five million. By 2020, they anticipate another 285,000 jobs.

Interestingly, since 2000, Seattle’s congestion costs (figured by cost of gas and driver time) have actually fallen: to $942 per year in 2010 versus $1,102 per year a decade earlier. That puts the Seattle MSA in tenth place nationally, behind Boston (9th), Denver (8th), and San Francisco (7th).

Congestion also impacts freight tonnage, where Seattle is twelfth, ahead of Boston this time, but behind Minneapolis. Usually, exports represent between 15 and 16 percent of Seattle’s gross metropolitan product (that ratio changed during the recession, edging into the 20s as exports stayed strong).

“Investment in roads, rails, and other forms of transportation,” claim the authors, “will help relieve the bottlenecks impeding economic expansion,” though they also write that “road capacity has not kept up with passenger growth, and public and alternative transportation usage and development has not been substantial enough to pick up the slack.” They also envisioned the average price for a gallon of gas falling to $3.11 per gallon at the end of 2012 (remember it’s around $3.70 now).

Doesn’t it seem that, in metro areas particularly, public transportation would come first, with roads taking up the slack?

The demand for transit in Seattle seems an indicator that the current ratio of roads to transit is unappealing to metro voters. A $10-billion transportation package unveiled by the state’s House Democrats would spend the vast majority of that $10 billion on new road projects, with $1 billion for maintenance and even less than that for public transportation. It does not help fund the 520 floating bridge replacement, which remains more than a billion dollars short, or the SR 99 tunnel. It doesn’t sound like it has yet sunk in, as STB announces, “Transit Supporters are the Key Swing Vote.”

Whooping Cough Vaccine (DTaP) Not as Long-Lived as Thought

(Image: CDC)

Back in July, with whooping cough cases up 1,300 percent in Washington State over last year, we reported that “nationally, vaccinated 13- and 14-year-olds are contracting whooping cough in greater numbers, indicating that the childhood DTaP vaccine‘s protection is wearing off sooner than expected.” (Washington is now at 4,007 cases, compared to last year’s 405 total.)

Now a study from the Kaiser Permanente Vaccine Study Center in Oakland, California, confirms that suspicion. Published in the New England Journal of Medicine, the study, titled “Waning Protection after Fifth Dose of Acellular Pertussis Vaccine in Children,” has measured with a new level of precision the whooping cough (pertussis) vaccine’s effects.

“After the fifth dose of DTaP, the odds of acquiring pertussis increased by an average of 42% per year,” the study’s authors write. Said another way, the overall protection rate of the DTaP vaccine declines to 71 percent from 95 percent by the fifth year after the fifth shot. (A further caveat, though, is that while immunity falls, vaccinated kids don’t get as sick from whooping cough.)

For context, unvaccinated children have odds of getting whooping cough “at least eight times higher than children who received all five doses” of DTaP (CDC pdf).

Previously, this kind of study was difficult to do because of the switch from the whole-cell vaccine to DTaP, which muddied results, and the necessity of making sure everyone had gotten the same number of shots. (Nationally, 95 percent of children get three and 85 percent get four. Fewer get all five.)

The whole-cell vaccine contains inactive B. pertussis cells; while lab tests differ, it seems more effective than DTaP in actual practice. It’s still used around the world (worldwide, it’s estimated that nearly 300,000 children die of whooping cough annually), but the U.S. switched to the bits-of-cells DTaP in 1991 because of its lower rate of–and milder–side effects, including soreness at the injection site and fever.

MedLine Plus breaks out the rates for more severe reactions:

  • Non-stop crying for more than 3 hours (1 in 1,000 children)
  • Fever over 105 degrees (1 in 16,000 children)
  • Seizures (1 in 14,000 children)

(A 2001 study was able to show that mice developed seizures similar to those seen in children who got the whole-cell vaccine.)

The Kaiser Permanente study was able to isolate children who got their five DTaP shots between 47 to 84 months of age, and contrast those who got whooping cough (277) with DTaP-ers who didn’t (3,318), as well as with a larger sample of “matched controls” (6,086) drawn from the general population of Kaiser patients. From this, they were able to determine that the key factor was time; the children who contracted whooping cough were more likely to have gotten their fifth shot earlier, giving their immunity more time to wane.

The goal has long been a more effective vaccine, that would require fewer than five doses. This news only adds fuel to that effort. Adults would likely appreciate an advance in vaccine strength, too. The Tdap vaccine for adults provides only 55 percent protection. Whooping cough is generally less severe for adults, but it can lead to pneumonia if you don’t know you have it.

What Lies Beneath Mount St. Helens? Scientists Plan a Volcanic CAT Scan

Mount St. Helens, seen from I-5 (Photo: MvB)

“Imaging Magma Under St. Helens” is the name of a new research project (aka iMUSH) that’s just gotten National Science Foundation funding. Beginning in 2014, scientists with the University of Washington; the Rice, Columbia, and Oregon State universities; and the USGS will embark on a four-year study of Mount St. Helens, the most seismically active volcano in the Cascades mountain range.

St. Helens has been percolating off and on for between 300,000 and 500,000 years, but what’s really going on down there remains mysterious. Magma somehow makes it from the subduction zone where the oceanic Juan de Fuca plate grudgingly curves under the continental North American plate, perhaps 66 miles down. But although the mountain might add to its height with a lava dome, the 1980 eruption of St. Helens was marked by gas and ash–a plinian eruption–rather than torrents of “liquid hot magma.”

What gives? Researchers will throw eight of their best X-Ray Specs techniques at the problem, upping the amount of seismography on and around the mountain substantially. (St. Helens has been under a seismographic microscope for a while, even before the 1980 eruption, and you can follow along with its mini-quakes online–it averages about 22 per month.)

One way of getting a better “look” is with the anodyne-sounding “active seismography“–which means they’ll be drilling 80-foot-deep shafts and setting off explosions in them. For science. They’ll also use receiver function analyses, ambient noise tomography (that’s when you listen to the Earth hum), and magnetotelluric surveys.

Because the Earth transmits telluric currents, depending on fluctuations in its magnetic field, you can listen in to how well they’re being conducted, and learn something about the make-up of the ground beneath your feet. Magnetotelluric surveys can manage incredibly deep soundings, up to 6,000 miles.

Researchers will also be looking for the cause of deep, long-period quakes (DLP earthquakes, of which there have been “9 events since 1980, generally located 5-10 km southeast of Mount St Helens at 25-30 km depth”)–is it magma shifting into new reservoirs? Another fluid? Petrology, another tool in the utility belt, will focus on samples of igneous rock and try to trace the circumstances of their formation.

All in all, the scientists will have more precise, higher-resolution data to pore over, seeing more deeply and thoroughly into the Mount St. Helens region than ever before. “The National Science Foundation will spend about $3 million on the project,” says The Columbian, in its story–the grants will be parceled out to lead investigators at the collaborating institutions over the next few years.