Tag Archives: traffic

Reminder: 520 Bridge Closed for the Weekend

Birds, or floating bridge construction, whatever you’re in the mood for (Photo: MvB)

The Washington Department of Transportation reminds you that they’re closing the 520 bridge for construction this weekend, July 12th to 15th, from 11 p.m. Friday until 5 a.m. Monday. In conjunction with that I-405 northbound through Bellevue will be closed as well, starting at 10 p.m. tonight.

This weekend’s 520 closure is for a scheduled inspection, and for maintenance and repair, from Montlake to I-405. I-405’s closure, from Southeast Eighth Street to SR 520 (and the eastbound and westbound I-90 ramps to northbound I-405), will allow WSDOT crews to replace concrete panels in the two left lanes between Southeast Eighth and Main Streets. Your alternate routes are I-5, I-90, and a kayak.

That means Eastsiders who want to catch the Ms playing the Angels tonight at SAFECO at 7:10 p.m. had better plan to use I-90 on the way home, or hope the game doesn’t go into extra innings.

Saturday morning, before any of you are up, about 10,000 cyclists will be pedaling out of Seattle on their way to Portland for STP. They leave in waves between 4:45 and 7:30 a.m., taking off from a UW parking lot and biking down Montlake to Pacific, crossing the University Bridge, and then taking Furhman to Boyer to Lake Washington Boulevard. Less pedaling gets you to Sub Pop’s Silver Jubilee in Georgetown, all day, from 10 a.m. to 11 p.m.

Denny Way will be closed between Fourth and Fifth Avenue so that a crane can be put up. 12th Avenue between Pike and Pine will be closed from 1 to 4 p.m. for the Seattle Police East Precinct Picnic. From 3 to 8 p.m., East Madison between 27th Avenue E and 30th Avenue E will be closed for the Bastille Bash.

Both Saturday and Sunday all sorts of streets will be closed in the International District for Dragon Fest.
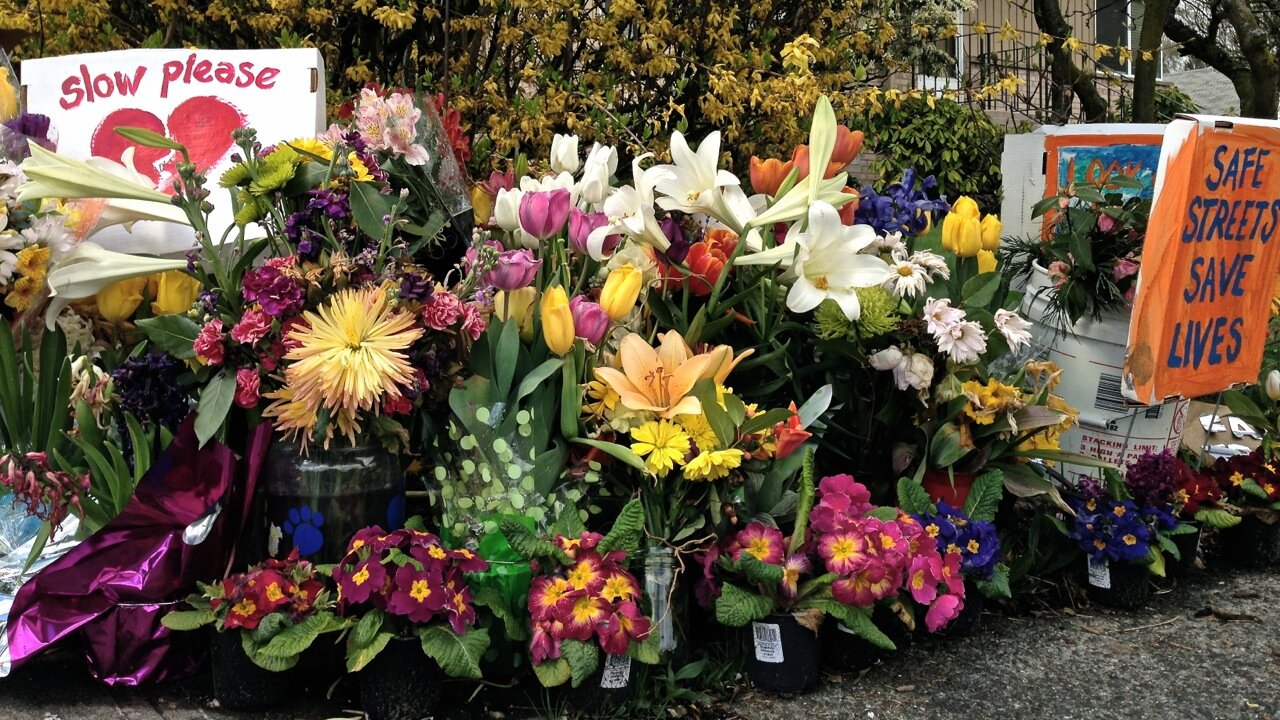
Northwest Bucks National Trend Toward Increase in Traffic Deaths

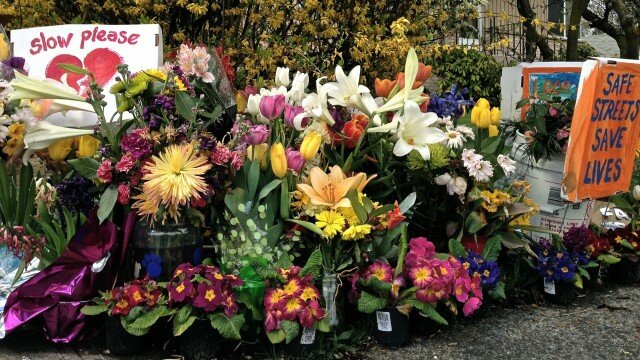
Streetside memorial at NE 75th St, after a fatal collision (Photo: MvB)

Seattle may rank eighth on INRIX’s 2012-13 ranking of the “Top 10 Worst Cities for Traffic in America,” but if early projections from the National Highway Traffic Safety Administration stand, the Northwest will have notched a seventh-straight-year of declining traffic fatalities. That’s in contrast to the U.S. as a whole, which saw fatalities increase by five percent between 2012 and 2011, to a rate of 1.16 deaths per 100 million vehicle miles traveled (VMT), for a total of 34,080.

Context is important: That five-percent rise still makes 2012 one of the safest years in the past 60. Back in the 1960s, when Don Draper and colleagues were tooling around half in the bag, the fatality rate was more like five deaths per 1oo million VMT. In Washington State, it reached an all-time low of 0.8 in 2010 and 2011. In 2011, just 454 traffic fatalities were recorded.

Traffic volume was up very slightly, by just 0.3 percent, but only the Northwest Region 10  (Washington, Oregon, Idaho, Montana, and Alaska) and Region 2 (New York, New Jersey, and Pennsylvania) managed a reduction of traffic fatalities, year-over-year, of one percent. New England and the Southwest reached double digits in their increase in deaths, trailed by California and Arizona with their nine-percent rise.

Most of the spike in traffic deaths came during the wintry first quarter of 2012.

Because the numbers are preliminary, the NHTSA isn’t pointing fingers at specific causes. It was true, though, that in 2011, about half of all people killed in accidents weren’t wearing their seat belt. (In Washington State, where seat belt usage is high, about one-third of people killed weren’t wearing theirs.) Texas, which has the fastest speed limits in the country, has seen an increase in deaths from single-vehicle accidents — losing control of the car at 85 mph is more likely to kill you.

Why would people lose control? A survey finds that “at any given daylight moment” in the U.S., some 660,000 drivers are messing with their cell phone or other electronic device. Despite states banning texting or even holding a cell phone, that number has remained constant since 2010. Distracted driving meant the deaths of 3,331 people in 2011.

Legislature Taking Another Look at Safer, Slower Speeds on City Streets

If you lived here, you could have a car in your living room by now. This 24th Ave E & Montlake Blvd apartment's guard rail is put to heavy use each year. (Photo: MvB)
This 24th Ave E & Montlake Blvd apartment’s guard rail is put to heavy use each year. Unluckily for them, it’s an arterial, so slowing traffic would require costly engineering and traffic studies. (Photo: MvB)

The Neighborhood Safe Streets bill is back, says KIRO Radio’s Kim Shepard, saying there’s a “big push” to get it voted on this legislative session. The bill would allow municipalities across the state to lower speed limits on city roads to as slow as 20 mph without commissioning engineering and traffic studies (whose costs rise with the number of intersections involved). As the bill’s title indicates, the focus is on neighborhood pedestrian safety.

The bill applies specifically to nonarterial streets in residential or business districts, so the change in most cases would be just five miles per hour, to 20 from 25 mph. What’s the big deal? Here’s our earlier explanation:

It seems picayune. What difference could five miles per hour make? It turns out to be life-and-death, because the relationship of fatalities to speed is not linear.

Someone hit by a car traveling at 40 miles per hour has an over-80-percent chance of being killed. At 30, it’s still 37 to 45 percent. But at 20, it’s just five percent. The key factors are stopping time and response time–at 20 miles per hour, the driver is in control of their car, and can stop before hitting someone. As you increase speed, you have less time to respond, while stopping distance increases.

If a municipality wants to lower the speed limit on a stretch of state road, they’ll have to petition the state secretary of transportation. Studies will still be required for any increase in an existing speed limit, except that any newly lowered limit can be returned to its original state within one year.

It may seem like common sense to allow towns and cities this decision, but the bill got nowhere last session. This session, SB 5066 is being sponsored by Senators Billig, Litzow, Eide, Frockt, Rolfes and HB 1045, by Representatives Ryu, Angel, Moscoso, Clibborn, Upthegrove, Fitzgibbon  Liias, Pedersen, Stanford, Farrell, Morrell, Pollet, Bergquist, Fey. Shepard says the House Committee on Transportation is giving the proposed legislation its first hearing this afternoon.

New 520 Floating Bridge’s Pontoons are “Disaster,” Inspector Tells KOMO

WSDOT photo taken during the SR 520 pontoon media tour on Nov. 14, 2012.

KOMO News has more allegations from a former inspector, who says that the construction quality of the pontoons for replacement 520 bridge make it a “disaster waiting to happen.” His fate is instructive, especially when it comes to the state Department of Transportation’s response to KOMO inquiries.

WSDOT says, for instance: “WSDOT’s SR 520 construction contracts include multiple requirements for Quality Assurance (QA) managers and other Quality Assurance staff.” That sounds reassuring, but when you read their documentation, you discover that construction firm Kiewit, the “Design-Builder,” is responsible for all “QA and QC for design.”

WSDOT provides Quality Verification (QV) staff, but they get to see the finished results, when there’s significantly more at stake in ordering Kiewit to redo a piece. In this case, with cracks–and leaks–appearing in the pontoons, Kiewit is being asked to fix them. It is not clear how the firm can “fix” instances of the wrong rebar being used, misplaced, or left out entirely.

How this process seems to have played out is that the whistleblowing QA inspector was hired by a subcontractor to Kiewit to oversee construction. After he began writing up non-compliant construction methods, he was reprimanded, he says, and finally laid off after Kiewit complained about his sticklerism. (This is a similar dynamic reported by building inspectors who report shoddy condo construction. Your dance card empties out.)

WSDOT, troublingly, seems unhumbled by an August 2012 performance audit (pdf) that noted: “In general, it appears the Quality Management Plan is not being adhered to by KG and not being enforced by QA or QV.”

This all follows on KOMO’s earlier reporting that two experts agreed the first six pontoons should be “do-overs.” KOMO’s watchdogging had already gotten a promise from Governor Gregoire that an independent expert panel would review the pontoons. (In the Seattle Times, Secretary of Transportation Paula Hammond seemed impervious to alarm, pooh-poohing the issue of cracks in the pontoons: “I have no reason to believe we are going to reject pontoons.”)

Fixed and problem solved? KOMO’s Problem Solvers have since discovered that concrete in the next cycle of pontoons is cracking, as well.

Finally, you might ask what the hurry is? WSDOT has adopted a furious pace in shipping the pontoons, despite that fact that $1.4 billion in funding for the project remains to be found. Despite predicting traffic volumes of between 90,000 and 100,000 cars per day in the first year of tolling on 520, WSDOT reported that an average of 63,500 cars crossed the bridge weekdays, January to June 2012.

A recent budget update sliced $522 million from the project’s original $4.65 billion price, reducing it to $4.1 billion, which should help slightly with subpar toll revenue. But ultimately, moving money from pot to pot leads to stories like these: WSDOT is also said to have reduced the amount it was to pay MOHAI for its land to $4 million from $18 million (when I asked for details, a WSDOT communications officer told me she’d get back to me after a meeting on that topic, and did not).

Allstate: You Really Suck at Driving, Seattle

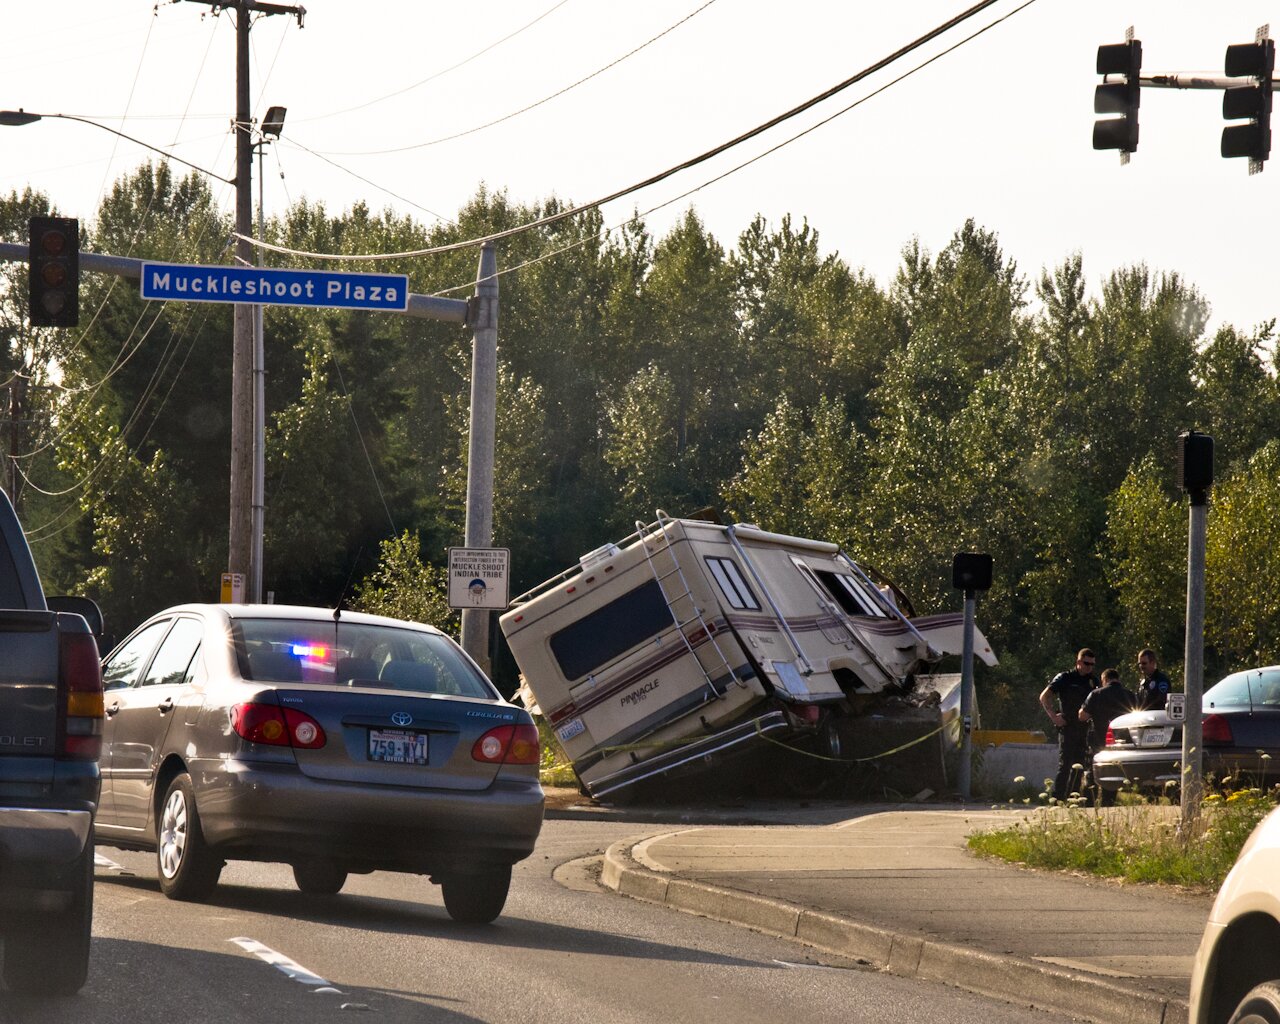
RV catastrophe–not in Seattle proper but remarkable, isn’t it? (Photo: MvB)

Apparently, the message is that you had better be in good hands if you’re driving in Seattle, because you’re more likely to get into an accident. Out of a field of 200 U.S. cities, Seattle comes in 154th. Where the national average for car accidents is one every ten years, in Seattle, the average driver will collide–or be collided with–every 7.9 years. (Whereas an average Sioux Falls driver, in the top spot, will go almost 14 years between smashups.)

The Eighth Annual “Allstate America’s Best Drivers Report” is not supposed to be a shaming document. “We don’t want drivers in Seattle to be discouraged by their ranking. Instead, we want the report to challenge drivers in Seattle to make positive changes to their driving habits that will in turn make the city a safer place to live, work and raise families,” is the diplomatic framing of Shauna McBride, Allstate’s Regional Spokesperson.

But let’s go ahead and note right here that Tacoma is worse–in 156th place. Those people drive like maniacs. Around the Northwest, Spokane comes in 43rd, slightly bettering the national average, at 10.6 years between bent fenders. But Boise, Idaho, is the real star, coming in second, just a hair behind Sioux Falls. Boise! We throw up our hands.

As Allstate’s tips on safer driving boil down to “drive more safely,” they may be of limited use. One might reasonably assume that people who drive in a rush, distractedly, without a clear idea of where they’re headed, tailgating, unaware of the rules of the road, speeding, and without looking for pedestrians have been told, repeatedly, to be more careful already, without it sinking in. And actually, all of those sound like Seattle driving behaviors, except for the not watching for pedestrians part. (Not that people aren’t run down and killed even so.)

All that is needed now is an overlay of smart phone penetration in U.S. cities, so we can see the relationship between distracted driving and collisions. (Or, to triage the problem, distracted driving and fatalities.) “Sending or receiving a text takes a driver’s eyes from the road for an average of 4.6 seconds, the equivalent-at 55 mph-of driving the length of an entire football field, blind,” says the Virginia Tech Transportation Institute.

For you statistical wonks, here is some background on the Allstate report’s reliability:

A weighted average of the two-year numbers determined the annual percentages. The report defines an auto crash as any collision resulting in a property damage claim. Allstate’s auto policies represent about 10 percent of all U.S. auto policies, making this report a realistic snapshot of what’s happening on America’s roadways.